About CalHealthMap
The CalHealthMap tool aims to map population health at the neighborhood scale across California. This information can be used to target areas where interventions to improve local air quality or other environmental variables could improve population health. To accomplish this, CalHealthMap analyzes health outcomes linked to air pollution, as established in scientific literature, by modeling “excess rates” of Emergency Room (ER) visits and all-cause mortality. It focuses specifically on smaller, zip code-areas that can experience disproportionately higher health burdens compared to other regions.
CalHealthMap differs from other web-based dashboards such as CalEnviroScreen, the Healthy Places Index (HPI), and Tracking California. For example:
- CalEnviroScreen integrates environmental exposures, a limited set of health outcomes, and socioeconomic vulnerabilities into a summary indicator of cumulative disadvantage by census tract;
- HPI examines a broad range of social determinants of health, such as housing and education, plus a limited number of environmental indicators;
- Tracking California focuses on some of the same health outcomes as CalHealthMap, but supplies most estimates only at the county level (asthma and COPD are provided at the zipcode level).
In contrast, CalHealthMap includes a wide array of health outcomes related to air pollution, with estimates of excess mortality and ER visits using historical and age-adjusted data at the zip-code level. As such, CalHealthMap offers a unique tool for identifying health trends at the community level.
CalHealthMap does not identify specific causes of health differences, which typically arise from a blend of social, environmental, and lifestyle factors. The tool is not designed to provide public advocacy training.
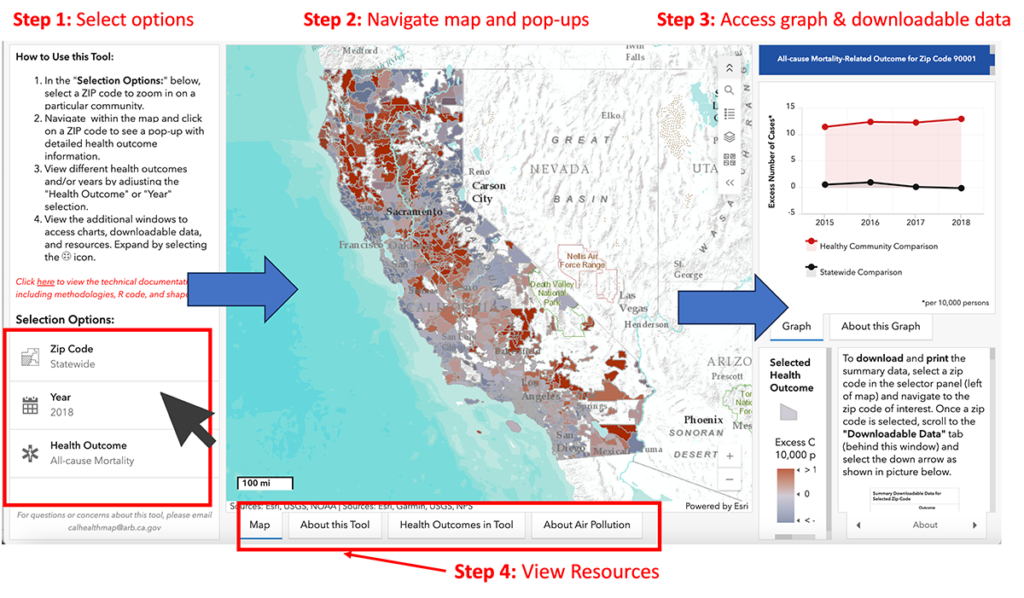
Step 1: In the “Selection Options:“, select a zip code to zoom in on a particular community. Step 2: Use your mouse to navigate within the map and click on a zip code to see a pop-up with detailed health outcome information. Step 3: Adjust the “Health Outcome” or “Year” selection to view different health outcomes and/or years. Step 4: To access resources, charts, and downloadable data, view the additional windows; expand by selecting the icon below (found on upper-right corner of each embedded window):
Glossary of Data Terms
- Total Number of Cases (per 10,000 people) shows the number of people (modeled, accounting for age and sex) in a specific zip code who went to the ER for a health outcome issue, like asthma, or how many people who passed away died from a particular cause. This total is reported for every 10,000 people in the area, helping us understand the overall health burden within that community.
- Excess Number of Cases (per 10,000 people) tells us how many more people than expected (modeled, accounting for age and sex) in a specific zip code went to the ER for a health outcome, like asthma, or how many more deaths from a particular cause occurred than expected. This metric indicates whether a health outcome in a specific zip code is more or less frequent than what is expected if the community’s health burden had been the same as in the reference population (for example, in either the statewide population or California’s healthiest communities).
- The Standardized Morbidity or Mortality Ratio (SMR) is the number of ER visits for a health outcome (for example, asthma) or deaths in a specific zip code, compared to the number expected. Specifically, it is a ratio of the observed cases of a health outcome over the number of cases expected. An SMR of 1 indicates that the health burden in a specific zip code is no different than in the reference population (for example, in either the statewide population or California’s healthiest communities). An SMR above 1 indicates more cases than expected, while an SMR below 1 indicates fewer cases than expected. This metric helps identify zip codes with unusually high or low numbers of ER visits or deaths compared to either the rest of the state or California’s healthiest communities.
- Relative Risk (RR) is the chance of an ER visit for a health outcome (for example, asthma) or death in a specific zip code, compared to the state average. An RR of 1 means that the risk for the health outcome in a specific zip code is no different than in the reference population (for example, in either the statewide population or California’s healthiest communities). If the RR is higher than 1, it means the risk is greater than expected, while an RR below 1 means the risk is lower than expected. Note: For improved accuracy, the calculation of RR in CalHealthMap utilizes a method called spatial smoothing. This means the RR in one zip code is partly based on information from nearby zip codes. Using data from neighboring areas helps generate more reliable results, especially in places with fewer people or limited data.
- The lower and upper limits of the RR define the boundaries of a confidence interval. The Lower Limit (LL) represents the minimum plausible value of the RR, while the Upper Limit (UL) indicates the maximum plausible value. If the confidence interval includes 1, then the risk for the health outcome in the zip code is not meaningfully different from the risk in the reference population (for example, in either the statewide population or California’s healthiest communities).
- California’s healthiest communities are the 25% of zip codes with the highest Healthy Places Index (HPI) scores. The Healthy Places Index defines a healthy community as one that provides residents with access to quality education, good jobs, safe housing, clean air and water, healthcare, and strong social support, using 25 indicators across these areas. The higher the HPI score, the healthier the commu